如何使用 Mapbox 和 React 创建 COVID-19 地图
在当前的世界形势下,我们中的许多人都处于封锁状态,我认为暂时放下 Netflix,构建一个类似于霍普金斯仪表板的COVID 地图是个好主意。
我们的版本会更简单,但您可以自行决定是否添加更多功能。
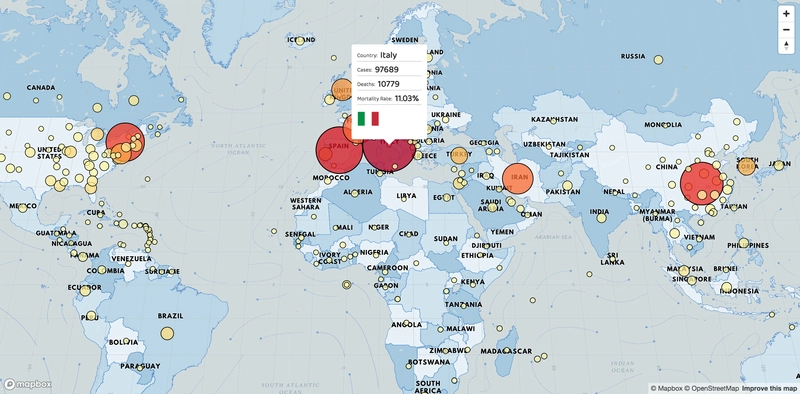
这就是我们要构建的内容⭐ https://codesandbox.io/s/mapbox-covid19-8sni6 ⭐。得益于 Mapbox 的易用性,这比你想象的要容易得多。
这将是一篇很长的教程,但如果你像我一样没有耐心……这里有你需要的所有链接。你也可以滚动到底部查看扩展资源列表,或者点击👉这里。
🗒️ NOTE:我将使用 React,因为它是我最喜欢的框架/库和用于编写 css 的 scss。
🔗链接:
- 现场演示
- Github仓库
- CodeSandbox(使用 Mapbox 教程中的访问密钥,哈哈 - 可能会在某个时候停止工作)
- COVID-19 API 数据
教程
让我们开始教程吧
| 您可以使用此菜单跳至每个步骤。
1.初始设置
理想情况下,您应该克隆这个CodeSandbox,它已设置好所有内容,包括 css 和初始化的空地图。
但如果你愿意,你也可以使用类似create-react-app 的东西:
# Create a new folder using create-react-app and cd into it
npx create-react-app mapbox-covid
cd mapbox-covid
# Packages to use in this tutorial
npm i node-sass mapbox-gl swr country-code-lookup
# Start a local server
npm i && npm start
现在您已经准备好 React 和本教程的所有包。
接下来:清理所有默认文件,特别是执行以下操作:
- 从 App.js 中删除所有内容
- 删除 App.css 中的所有内容
- 将 App.css 重命名为 App.scss 以使用 sass
2. 设置 Mapbox
从https://account.mapbox.com/获取一个帐户,您的访问令牌将位于您的帐户仪表板中。
要初始化 Mapbox,您需要 4 样东西:
- 您的访问令牌(您刚刚获得的)
- 渲染地图的 DOM 容器
- 要使用的样式地图:
- 您可以使用 Mapbox 的默认设置
mapbox://styles/mapbox/streets-v11。 - 但在本教程中,我们将使用才华横溢的 Nat Slaughter 设计的Le-Shine 主题- 他是 Apple 的地图设计师。
- 您可以使用 Mapbox 的默认设置
- 初始地理位置:
- 您可以使用此工具来查找您的地理位置值。
- 为此,让我们用非常缩小的世界视角来展示 COVID-19 的影响。
App.js这是将这些步骤放在一起后的浓缩代码。
import React, { useRef, useEffect } from 'react';
import mapboxgl from 'mapbox-gl';
import useSWR from 'swr'; // React hook to fetch the data
import lookup from 'country-code-lookup'; // npm module to get ISO Code for countries

import './App.scss';

// Mapbox css - needed to make tooltips work later in this article
import 'mapbox-gl/dist/mapbox-gl.css';

mapboxgl.accessToken = 'your-access-token';

function App() {
  const mapboxElRef = useRef(null); // DOM element to render map

  // Initialize our map
  useEffect(() => {
    // You can store the map instance with useRef too
    const map = new mapboxgl.Map({
      container: mapboxElRef.current,
      style: 'mapbox://styles/notalemesa/ck8dqwdum09ju1ioj65e3ql3k',
      center: [-98, 37], // initial geo location
      zoom: 3 // initial zoom
    });

    // Add navigation controls to the top right of the canvas
    map.addControl(new mapboxgl.NavigationControl());

    // Add navigation control to center your map on your location
    map.addControl(
      new mapboxgl.GeolocateControl({
        fitBoundsOptions: { maxZoom: 6 }
      })
    );
  }, []);

  return (
    <div className="App">
      <div className="mapContainer">
        {/* Assigned Mapbox container */}
        <div className="mapBox" ref={mapboxElRef} />
      </div>
    </div>
  );
}

export default App;
- 接下来,让我们添加一些 css
App.scss,这将包括本教程的工具提示部分的 css。
/* This usually goes in the global but let's keep it here
   for the sake of this tutorial */
body {
  width: 100vw;
  height: 100vh;
  margin: 0;
  padding: 0;
  overflow: hidden;
}

/*  Make our map take the full viewport - 100% */
#root,
.App,
.mapContainer,
.mapBox {
  width: 100%;
  height: 100%;
}

/* Tooltip code */
.mapboxgl-popup {
  font-family: 'Baloo Thambi 2', cursive;
  font-size: 10px;
  padding: 0;
  margin: 0;
  color: #424242;
}

.mapboxgl-popup-content {
  padding: 1rem;
  margin: 0;

  > * {
    margin: 0 0 0.5rem;
    padding: 0;
  }

  p {
    border-bottom: 1px solid rgba(black, 0.2);

    b {
      font-size: 1.6rem;
      color: #212121;
      padding: 0 5px;
    }
  }

  img {
    width: 4rem;
    height: 4rem;
  }
}
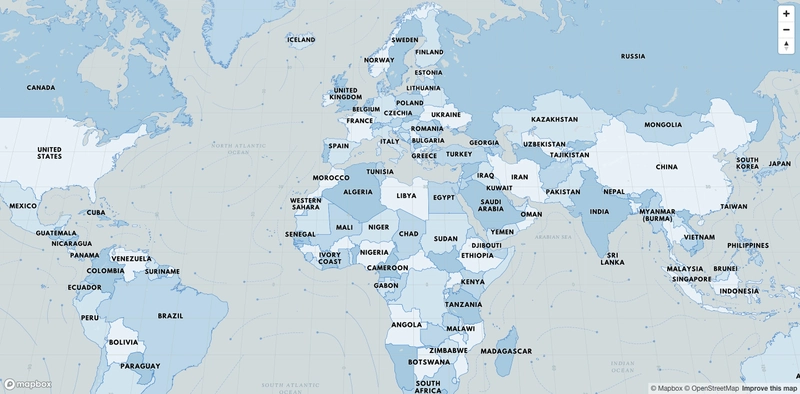
📍 Checkpoint:此时,你的屏幕上应该出现类似这样的内容:
3. 添加 COVID-19 数据 👨💻
我们将使用这个 API:
让我们使用此 API 路径https://disease.sh/v3/covid-19/jhucsse,它返回具有 COVID-19 统计数据的国家或省份列表。
响应如下所示:
[{
  "country": "Canada",
  "province": "Ontario",
  "updatedAt": "2020-03-29 23:13:52",
  "stats": { "confirmed": 1355, "deaths": 21, "recovered": 0 },
  "coordinates": { "latitude": "51.2538", "longitude": "-85.3232" }
},...]
我们将使用经验丰富的Vercel团队的swr来获取数据并将其转换为 mapbox geojson 格式的数据,其格式应如下所示:
data: {
  type: "FeatureCollection",
  features: [{
      {
        type: "Feature",
        geometry: {
          type: "Point",
          coordinates: ["-85.3232", "51.2538"]
        },
        // you can add anything you want to the properties object
        properties: {
          id: 'unique_id'
          country: 'Canada',
          province: 'Ontario',
          cases: 1355,
          deaths: 21
        }
      }
  }, ...]
}
🗒️ NOTE:请注意我如何向每个点的属性对象添加一个唯一的 ID,我们稍后将使用它来实现工具提示功能。
Mapbox 通过结合源层和样式层来工作。
数据源为地图提供数据,样式层负责以可视化的方式呈现这些数据。在我们的例子中:
- 我们的源是
data我们在上一步中获得的对象 - 我们的样式层将是一个点/圆层
🗒️ NOTE:您需要在图层上引用源 ID,因为它们是相辅相成的。
例如:
// once map load
map.once('load', function () {
  // Add our source
  map.addSource('points', options);

  // Add our layer
  map.addLayer({
    source: 'points' // source id
  });
});
通过整合这些概念,您的代码现在应该看起来像这样:
function App() {
  const fetcher = (url) =>
    fetch(url)
      .then((r) => r.json())
      .then((data) =>
        data.map((point, index) => ({
          type: 'Feature',
          geometry: {
            type: 'Point',
            coordinates: [point.coordinates.longitude, point.coordinates.latitude]
          },
          properties: {
            id: index, // unique identifier in this case the index
            country: point.country,
            province: point.province,
            cases: point.stats.confirmed,
            deaths: point.stats.deaths
          }
        }))
      );

  // Fetching our data with swr package
  const { data } = useSWR('https://disease.sh/v3/covid-19/jhucsse', fetcher);

  useEffect(() => {
    if (data) {
      const map = new mapboxgl.Map({
        /* ... previous code */
      });

      // Call this method when the map is loaded
      map.once('load', function () {
        // Add our SOURCE
        // with id "points"
        map.addSource('points', {
          type: 'geojson',
          data: {
            type: 'FeatureCollection',
            features: data
          }
        });

        // Add our layer
        map.addLayer({
          id: 'circles',
          source: 'points', // this should be the id of the source
          type: 'circle',
          // paint properties
          paint: {
            'circle-opacity': 0.75,
            'circle-stroke-width': 1,
            'circle-radius': 4,
            'circle-color': '#FFEB3B'
          }
        });
      });
    }
  }, [data]);
}
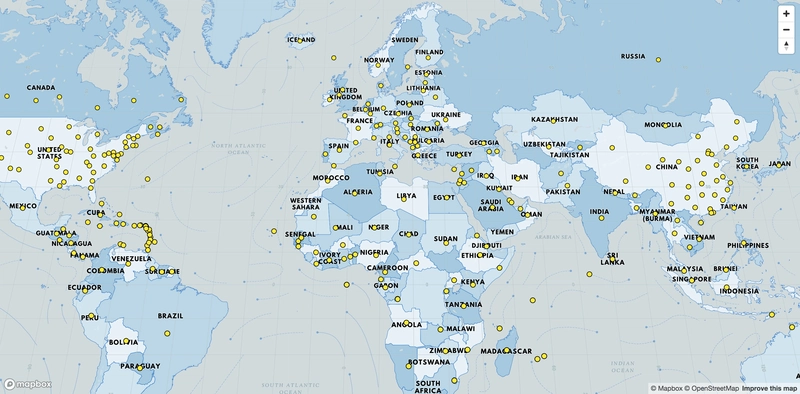
📍 Checkpoint:如果一切顺利,你应该会看到类似这样的内容:
4. 缩放并着色点
🌋但我们有一个问题:每个点都是平等的,而 COVID-19 对世界的影响肯定是不平等的——为了解决这个问题,让我们根据病例数量增加每个圆的半径。
为此,我们使用一种叫做数据驱动样式的东西。这里有一个不错的教程。
简而言之,这是一种paint使用源数据修改图层属性的方法。
对于圆半径来说它看起来像这样:
   "circle-radius": [
     "interpolate",
     ["linear"],
     ["get", "cases"],
     1, 4,
     50000, 25,
     100000, 50
   ],
这👆可能看起来像某种黑魔法,但事实并非如此,这段代码正在执行以下操作:
- 我将使用
interpolate数据,它只是一个花哨的词,用于将一个范围(案例数量)映射到另一个范围(圆半径)。 - 它将线性发生。
- 我们将使用对象
cases中的属性data将其映射到 paint 属性circle-radius。
例如:
1主动壳体 = 半径450000活跃病例 = 半径25100000活跃病例 = 半径50
因此,例如,如果我们有75000案例,mapbox 将创建一个半径37.5为 25 和 50 之间的中点。
🗒️ NOTE:随着病毒数量的增加,您可能需要更改此范围,因为不幸的是,100000 将成为常态,而不是上限。
📆 [2021 Update]👆 很遗憾发生了这个问题,这个问题已在5. 将值插入到数据集中
对于我们的教程,我们不会使用完全线性的方法,我们的缩放系统将有一些步骤来更好地表示数据,但这些步骤之间的插值将是线性的。
它看起来是这样的,但你可以随意调整它:
paint: {
-   "circle-radius": 4,
+   "circle-radius": [
+     "interpolate",
+     ["linear"],
+     ["get", "cases"],
+     1, 4,
+     1000, 8,
+     4000, 10,
+     8000, 14,
+     12000, 18,
+     100000, 40
+   ],
}
🗒️ NOTE:当您放大和缩小时,Mapbox 将正确缩放圆圈,以使其适合屏幕。
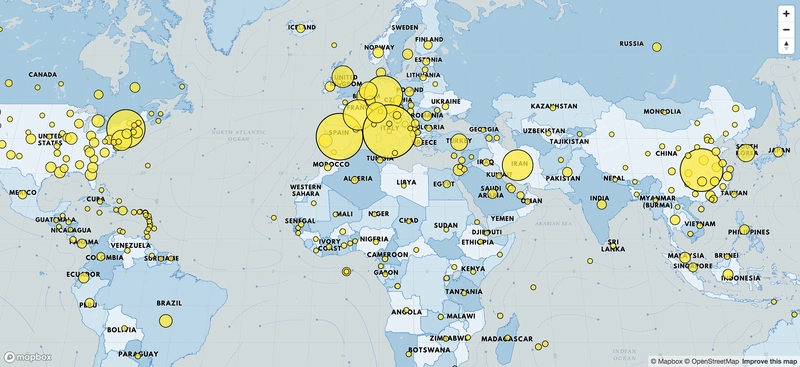
📍 Checkpoint:现在,你的屏幕上应该出现类似这样的内容:
接下来,让我们对 circle-color 属性执行相同的操作。
我将使用colorbrewer2的调色板,它有专门为地图制作的调色板 - 这是我挑选的 👉链接🔗。
paint: {
-   "circle-color": "#FFEB3B",
+   "circle-color": [
+     "interpolate",
+     ["linear"],
+     ["get", "cases"],
+     1, '#ffffb2',
+     5000, '#fed976',
+     10000, '#feb24c',
+     25000, '#fd8d3c',
+     50000, '#fc4e2a',
+     75000, '#e31a1c',
+     100000, '#b10026'
+   ],
}
我还将调整边框宽度(circle-stroke-width)以从 1 到 1.75 的比例缩放:
paint: {
-   "circle-stroke-width": 1,
+   "circle-stroke-width": [
+     "interpolate",
+     ["linear"],
+     ["get", "cases"],
+     1, 1,
+     100000, 1.75,
+   ],
}
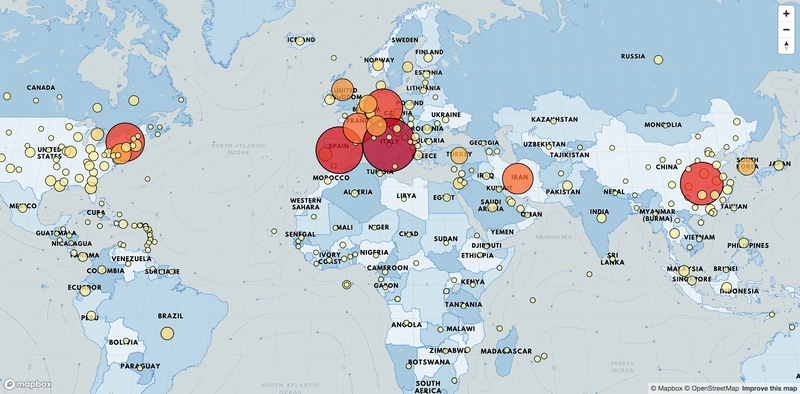
📍 Checkpoint:此时,你应该在屏幕上看到这张漂亮的地图:
5. 将值插入数据集 [2021 更新]
当我制作本教程时,我认为每个省或国家的 COVID 病例数永远不会超过 100000 例,但不幸的是,我错了。
为了使我们的应用程序面向未来,我们需要创建一个比例线性尺度(插值),为此我们需要找到数据集的最小值、最大值和平均值。
const average = data.reduce((total, next) => total + next.properties.cases, 0) / data.length;

const min = Math.min(...data.map((item) => item.properties.cases));

const max = Math.max(...data.map((item) => item.properties.cases));
圆半径更新
paint: {
-   "circle-radius": { /* Old scale */},
+   "circle-radius": [
+     "interpolate",
+       ["linear"],
+       ["get", "cases"],
+       1,
+       min,
+       1000,
+       8,
+       average / 4,
+       10,
+       average / 2,
+       14,
+       average,
+       18,
+       max,
+       50
+   ],
}
圆圈颜色更新
paint: {
-   "circle-color": { /* Old scale */},
+   "circle-color": [
+     "interpolate",
+       ["linear"],
+       ["get", "cases"],
+       min,
+       "#ffffb2",
+       max / 32,
+       "#fed976",
+       max / 16,
+       "#feb24c",
+       max / 8,
+       "#fd8d3c",
+       max / 4,
+       "#fc4e2a",
+       max / 2,
+       "#e31a1c",
+       max,
+       "#b10026"
+    ]
}
圆形描边宽度更新
paint: {
-   "circle-stroke-width": { /* Old scale */},
+   "circle-stroke-width": [
+      "interpolate",
+      ["linear"],
+      ["get", "cases"],
+      1,
+      1,
+      max,
+      1.75
+    ],
您可以尝试使用这些值来创建自己的比例
6. 添加悬停提示
🌋现在我们面临另一个问题:除了感知到的病毒对每个国家的影响之外,地图并没有提供太多信息,为了解决这个问题,让我们在悬停时添加国家/省份的唯一数据。
让我们向图层添加鼠标移动和鼠标离开监听器circles,并执行以下步骤:
- 将光标样式从指针切换为默认。
- 创建一个 HTML 元素插入到工具提示中,这是我们将使用的数据:
- 国家
- 省或州(如果存在)
- 案例
- 死亡人数
- 死亡率(死亡人数/病例)
- 旗帜(为此我们将使用npm 包与这个非常有用的 repo国家旗帜
country-lookup-code结合使用)
- 跟踪悬停的国家/地区的 ID - 这样,如果点之间的距离太近,我们就能保证工具提示仍然会切换位置。
🗒️ NOTE:如果您的点之间有足够的空间,您可以使用mouseenter它mousemove,它仅在进入图层时才会被调用。
// After your mapbox layer code inside the 'load' event

// Create a mapbox popup
const popup = new mapboxgl.Popup({
  closeButton: false,
  closeOnClick: false
});

// Variable to hold the active country/province on hover
let lastId;

// Mouse move event
map.on('mousemove', 'circles', (e) => {
  // Get the id from the properties
  const id = e.features[0].properties.id;

  // Only if the id are different we process the tooltip
  if (id !== lastId) {
    lastId = id;

    // Change the pointer type on move move
    map.getCanvas().style.cursor = 'pointer';

    const { cases, deaths, country, province } = e.features[0].properties;
    const coordinates = e.features[0].geometry.coordinates.slice();

    // Get all data for the tooltip
    const countryISO = lookup.byCountry(country)?.iso2 || lookup.byInternet(country)?.iso2;

    const countryFlag = `https://raw.githubusercontent.com/stefangabos/world_countries/master/data/flags/64x64/${countryISO.toLowerCase()}.png`;

    const provinceHTML = province !== 'null' ? `<p>Province: <b>${province}</b></p>` : '';

    const mortalityRate = ((deaths / cases) * 100).toFixed(2);

    const countryFlagHTML = Boolean(countryISO)
      ? `<img src="${countryFlag}"></img>`
      : '';

    const HTML = `<p>Country: <b>${country}</b></p>
              ${provinceHTML}
              <p>Cases: <b>${cases}</b></p>
              <p>Deaths: <b>${deaths}</b></p>
              <p>Mortality Rate: <b>${mortalityRate}%</b></p>
              ${countryFlagHTML}`;

    // Ensure that if the map is zoomed out such that multiple
    // copies of the feature are visible, the popup appears
    // over the copy being pointed to.
    while (Math.abs(e.lngLat.lng - coordinates[0]) > 180) {
      coordinates[0] += e.lngLat.lng > coordinates[0] ? 360 : -360;
    }

    popup.setLngLat(coordinates).setHTML(HTML).addTo(map);
  }
});

// Mouse leave event
map.on('mouseleave', 'circles', function () {
  // Reset the last Id
  lastId = undefined;
  map.getCanvas().style.cursor = '';
  popup.remove();
});
📍 Checkpoint:此时,您应该已经完成,它应该看起来像这样🍾:
完整项目
在这里找到完整的代码 - CodeSandbox - 请随意插入您的访问令牌,因为一段时间后该令牌可能不起作用。
后续步骤
进一步考虑以下几点:
- 按国家过滤。
- 按死亡人数而不是病例进行过滤。
- 添加包含一些常规信息的侧边栏,也许使用另一个 API。
- 使范围对数据进行动态调整,而不是将 100000 硬编码为上限,您可以获取病例数量最多的国家/地区,然后除以 7 并创建动态范围。
- 将数据保存到本地存储,这样您就不会经常访问 API - 例如,您可以让本地存储每 24 小时过期一次。
资源/参考
Leigh Halliday 📺 - YouTube 频道,有很多高质量视频,包括一些关于 Mapbox 的视频。他也值得拥有更多粉丝 :)
Mapbox 示例- 精彩的 Mapbox 教程合集
调色板
Mapbox 链接
Mapbox 主题库 🔗
位置助手 🔗
数据驱动样式教程 🔗
悬停弹出教程 🔗
COVID-19 链接
COVID-19意识
就这样……我们完成了,注意安全😷,待在家里🏘️。
现在你可以回去Netflix狂看《虎王》了🐅👑。
致谢
我在Jam3的两位才华横溢的队友在使用 Mapbox 的项目中与他们学到了一些东西。
- Bonnie Pham - bonnichiwa
- 尤里·穆连科 - ymurenko
 后端开发教程 - Java、Spring Boot 实战 - msg200.com
