使用 matplotlib 和 seaborn 进行Seaborn 多图子图绘制
GitHub 存储库
参考
在本微教程中,我们将学习如何使用 matplotlib 和 seaborn 创建子图。
导入所有需要的 Python 库
import pandas as pd
import seaborn as sns
from matplotlib import pyplot as plt
sns.set() # Setting seaborn as default style even if use only matplotlib
创建 DataFrame
我们正在使用来自 Kaggle 的带有统计数据集的 Pokemon。
下面的单元格导入数据集文件并创建 pokemon pandas DataFrame。因此使用pd.DataFrame.head函数显示前 4 行。
pokemon_filepath = '../datasets/pokemon.csv'
pokemon = pd.read_csv(pokemon_filepath)
pokemon.head()
绘制(和子图)样本
正如我们在 matplotlib 文档(文件末尾的参考资料)中看到的,subplots()没有参数会返回一个图形和一个轴,我们可以使用下面的语法解包。
fig, ax = plt.subplots()
fig.suptitle('A single ax with no data')
因此,我们可以为 subplots 函数提供两个参数:nrows和ncols。如果按此顺序传入,则无需输入参数名称,只需输入其值即可。在我们的示例中,我们创建了一个包含 1 行 2 列的图,但仍然没有传递任何数据。
fig, axes = plt.subplots(1, 2)
fig.suptitle('1 row x 2 columns axes with no data')
现在axes是 AxesSubplot 数组,因此我们可以单独访问每个 ax 并设置不同的标题。
更多参数:
- figsize设置图形的总尺寸
- sharex和sharey用于在图表之间共享一个或两个轴(需要数据才能工作)
fig, axes = plt.subplots(1, 2, sharex=True, figsize=(10,5))
fig.suptitle('Bigger 1 row x 2 columns axes with no data')
axes[0].set_title('Title of the first chart')
等等
fig, axes = plt.subplots(3, 4, sharex=True, figsize=(16,8))
fig.suptitle('3 rows x 4 columns axes with no data')
使用数据
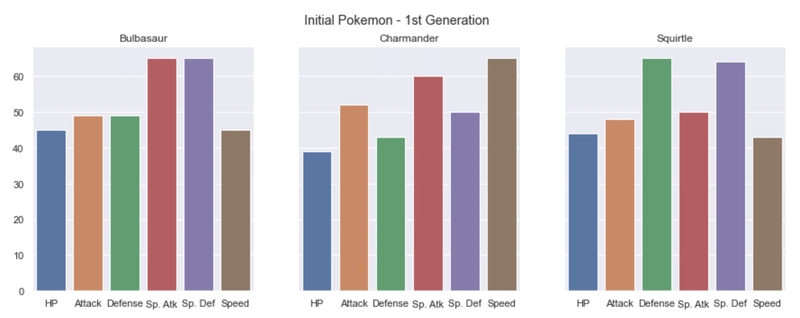
我们选择三只宝可梦用于下一个示例。第一代的三只初始宝可梦:妙蛙种子、小火龙和杰尼龟。
# bulbasaur = pokemon[['Name', 'HP', 'Attack', 'Defense', 'Sp. Atk', 'Sp. Def', 'Speed']][pokemon.loc[:, 'Name'] == 'Bulbasaur']
poke_num = pokemon[['Name', 'HP', 'Attack', 'Defense', 'Sp. Atk', 'Sp. Def', 'Speed']].set_index('Name')

bulbasaur = poke_num.loc['Bulbasaur']
charmander = poke_num.loc['Charmander']
squirtle = poke_num.loc['Squirtle']
然后,我们在 1 行 x 3 列的图中创建一个包含 3 个子图的图。
我们sns.barplot在需要的地方使用来自变量的对应元素来设置参数axes。
fig, axes = plt.subplots(1, 3, figsize=(15, 5), sharey=True)
fig.suptitle('Initial Pokemon - 1st Generation')

# Bulbasaur
sns.barplot(ax=axes[0], x=bulbasaur.index, y=bulbasaur.values)
axes[0].set_title(bulbasaur.name)

# Charmander
sns.barplot(ax=axes[1], x=charmander.index, y=charmander.values)
axes[1].set_title(charmander.name)

# Squirtle
sns.barplot(ax=axes[2], x=squirtle.index, y=squirtle.values)
axes[2].set_title(squirtle.name)
最后的例子
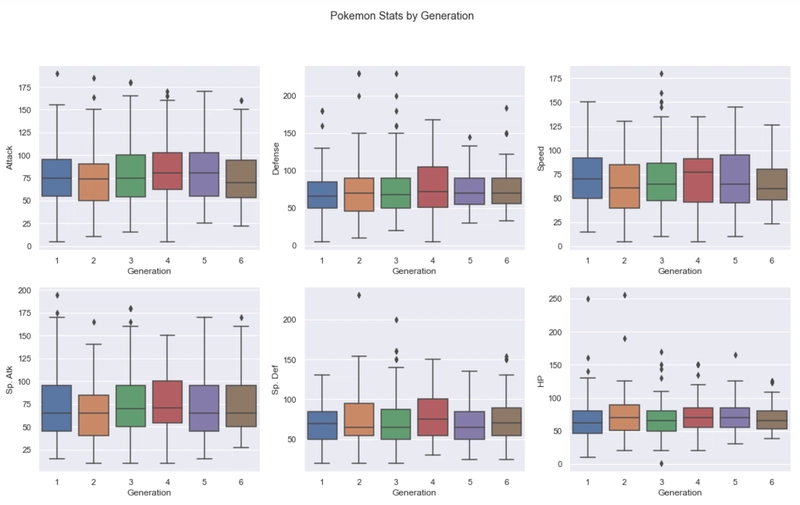
最后一个例子是绘制 2 行 X 3 列的图表,按世代显示 Pokemon 统计数据。
我们使用sns.boxplot
fig, axes = plt.subplots(2, 3, figsize=(18, 10))

fig.suptitle('Pokemon Stats by Generation')

sns.boxplot(ax=axes[0, 0], data=pokemon, x='Generation', y='Attack')
sns.boxplot(ax=axes[0, 1], data=pokemon, x='Generation', y='Defense')
sns.boxplot(ax=axes[0, 2], data=pokemon, x='Generation', y='Speed')
sns.boxplot(ax=axes[1, 0], data=pokemon, x='Generation', y='Sp. Atk')
sns.boxplot(ax=axes[1, 1], data=pokemon, x='Generation', y='Sp. Def')
sns.boxplot(ax=axes[1, 2], data=pokemon, x='Generation', y='HP')
GitHub 存储库
 thalesbruno / ds-micro-tutorials
使用 Python 的数据科学微教程
参考
matplotlib |使用 plt.subplot 创建多个子图
matplotlib | matplotlib.pyplot.subplots
seaborn | seaborn.barplot
seaborn | seaborn.boxplot
鏂囩珷鏉ユ簮锛�https://dev.to/thalesbruno/subplotting-with-matplotlib-and-seaborn-5ei8 后端开发教程 - Java、Spring Boot 实战 - msg200.com

