使用 D3 和 Vue 创建交互式地图
我为什么需要它
有很多方法可以将地图添加到您的网站或应用程序中:Google 地图、Mapbox、Leaflet 等等。这很简单。有些服务只需点击几下即可完成。
但是当你需要自定义设计、显示数据集或执行任何你想做的事情时,情况就变得很糟糕了。此外,在 Vue 或 React 中你不能使用 JSX,而必须使用命令式抽象 JavaScript API(但我使用 Vue,因为我对模板和响应式非常感兴趣)。
此外,一些图书馆对于私人项目来说并不是免费的。
因此,我不得不再次在地图上显示一些数据,我决定:我希望完全控制我的代码,并且我将使用二十一点和妓女创建自己的地图。
步骤1:创建静态地图。
让我们从带有 Babel 和 sass 的简单 vue-cli 3 应用程序开始。
我们需要 D3 和d3-tile(它不包含在 d3 npm 包中)来渲染地图图块。
yarn add d3 d3-tile
实际上我们不需要完整的 d3 代码。对于简单的地图,我们只需要 d3-geo 用于地图投影,以及 d3-tile 用于生成图块,所以我们只包含这两个包。
接下来我们应该定义一些设置,例如比例、宽度、高度和初始坐标。通常,我会通过计算挂载时元素的大小来使所有图表响应容器。
<script>
const d3 = {
  ...require('d3-geo'),
  ...require('d3-tile'),
};

export default {
  props: {
    center: {
      type: Array,
      default: () => [33.561041, -7.584838],
    },
    scale: {
      type: [Number, String],
      default: 1 << 20,
    },
  },
  data () {
    return {
      width: 0,
      height: 0,
    };
  },
  mounted () {
    const rect = this.$el.getBoundingClientRect();

    this.width = rect.width;
    this.height = rect.height;
  },
  render () {
    if (this.width <= 0 || this.height <= 0) {
      // the dummy for calculating element size
      return <div class="map" />;
    }

    return (
      <div class="map">our map will be here</div>
    );
  },
};
</script>

<style lang="scss" scoped>
.map {
  width: 100%;
  height: 100%;
}
</style>
现在定义投影和图块生成器。
export default {
  // ...
  computed: {
    projection () {
      return d3.geoMercator()
        .scale(+this.scale / (2 * Math.PI))
        .translate([this.width / 2, this.height / 2])
        .center(this.center)
      ;
    },
    tiles () {
      return d3.tile()
        .size([this.width, this.height])
        .scale(+this.scale)
        .translate(this.projection([0, 0]))()
      ;
    },
  },
  // ...
};
我总是将 d3 辅助函数定义为计算属性,因此当某些参数发生变化时,Vue 会重新计算它们并更新我们的组件。
现在我们已经拥有显示地图所需的一切,我们只需渲染生成的图块:
export default {
  render () {
    if (this.width <= 0 || this.height <= 0) {
      return <div class="map" />;
    }

    return (
      <div class="map">
        <svg viewBox={`0 0 ${this.width} ${this.height}`}>
          <g>
            {this.tiles.map(t => (
              <image
                key={`${t.x}_${t.y}_${t.z}`}
                class="map__tile"
                xlinkHref={`https://a.tile.openstreetmap.org/${t.z}/${t.x}/${t.y}.png `}
                x={(t.x + this.tiles.translate[0]) * this.tiles.scale}
                y={(t.y + this.tiles.translate[1]) * this.tiles.scale}
                width={this.tiles.scale}
                height={this.tiles.scale}
              />
            ))}
          </g>
        </svg>
      </div>
    );
  },
};
在这里,我们浏览由 d3-tile 生成的图块并从图块服务器请求图像。
您可以在这里找到其他服务器,甚至可以使用自定义样式托管自己的图块服务器。
不要忘记添加版权。
<div class="map__copyright">
©
<a
href="https://www.openstreetmap.org/copyright"
target="_blank"
>OpenStreetMap </a>
contributors
</div>
.map {
  // ...
  position: relative;
  font-family: Arial, sans, sans-serif;

  &__copyright {
    position: absolute;
    bottom: 8px;
    right: 8px;
    padding: 2px 4px;
    background-color: rgba(#ffffff, .6);
    font-size: 14px;
  }
}
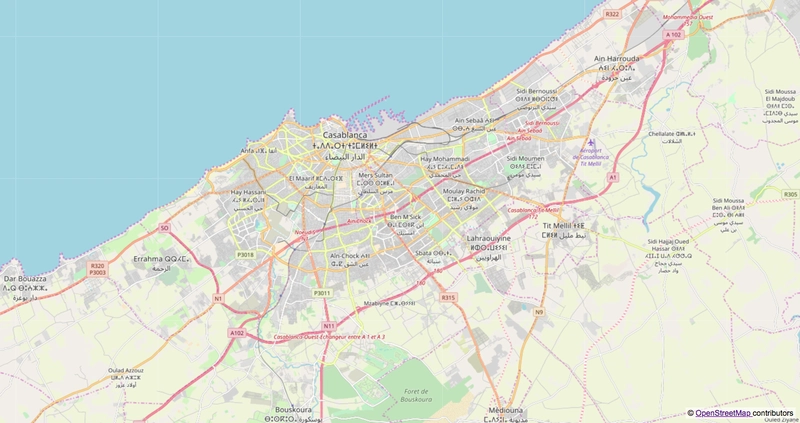
现在我们有了卡萨布兰卡的静态地图。还不是很精彩。
第 2 步:添加地图控件。
对我来说最激动人心的是 Vue 如何简化了创建交互式地图的过程。我们只需更新投影参数并更新地图即可。这就像第一次使用魔术一样简单!
我们将通过拖动地图来制作缩放按钮和位置控制。
让我们从拖动开始。我们需要在组件数据中定义投影平移属性,并在 svg 元素上定义一些鼠标事件监听器(或者你也可以在 tiles 组上监听它们)。
<script>
// ...

export default {
  // ...
  data () {
    return {
      // ...
      translateX: 0,
      translateY: 0,

      touchStarted: false,
      touchLastX: 0,
      touchLastY: 0,
    };
  },
  computed: {
    projection () {
      return d3.geoMercator()
        .scale(+this.scale / (2 * Math.PI))
        .translate([this.translateX, this.translateY])
        .center(this.center)
      ;
    },
    // ...
  },
  mounted () {
    // ...
    this.translateX = this.width / 2;
    this.translateY = this.height / 2;
  },
  methods: {
    onTouchStart (e) {
      this.touchStarted = true;

      this.touchLastX = e.clientX;
      this.touchLastY = e.clientY;
    },
    onTouchEnd () {
      this.touchStarted = false;
    },
    onTouchMove (e) {
      if (this.touchStarted) {
        this.translateX = this.translateX + e.clientX - this.touchLastX;
        this.translateY = this.translateY + e.clientY - this.touchLastY;

        this.touchLastX = e.clientX;
        this.touchLastY = e.clientY;
      }
    },
  },
  render () {
    // ...
    return (
      <div class="map">
        <svg
          viewBox={`0 0 ${this.width} ${this.height}`}
          onMousedown={this.onTouchStart}
          onMousemove={this.onTouchMove}
          onMouseup={this.onTouchEnd}
          onMouseleave={this.onTouchEnd}
        >
          // ...
        </svg>
        // ...
      </div>
    );
  },
};
</script>

<style lang="scss" scoped>
.map {
  // ...

  &__tile {
    // reset pointer events on images to prevent image dragging in Firefox
    pointer-events: none;
  }
  // ...
}
</style>
哇!我们只需更新翻译值,新的图块就会加载,这样我们就可以探索世界了。但是如果没有缩放控件,操作起来会不太方便,所以让我们实现它。
我们需要scale在组件的数据中移动道具,添加zoom属性并渲染缩放按钮。
根据我的经验,最小和最大图块的缩放级别分别为 10 和 27(老实说,我不太确定这是否适用于所有图块提供商)。
<script>
// ...

const MIN_ZOOM = 10;
const MAX_ZOOM = 27;

export default {
  props: {
    center: {
      type: Array,
      default: () => [-7.584838, 33.561041],
    },
    initialZoom: {
      type: [Number, String],
      default: 20,
    },
  },
  data () {
    return {
      // ...
      zoom: +this.initialZoom,
      scale: 1 << +this.initialZoom,
    };
  },
  // ...
  watch: {
    zoom (zoom, prevZoom) {
      const k = zoom - prevZoom > 0 ? 2 : .5;

      this.scale = 1 << zoom;
      this.translateY = this.height / 2 - k * (this.height / 2 - this.translateY);
      this.translateX = this.width / 2 - k * (this.width / 2 - this.translateX);
    },
  },
  // ...
  methods: {
    // ...
    zoomIn () {
      this.zoom = Math.min(this.zoom + 1, MAX_ZOOM);
    },
    zoomOut () {
      this.zoom = Math.max(this.zoom - 1, MIN_ZOOM);
    },
  },
  render () {
    // ...
    return (
      <div class="map">
        <div class="map__controls">
          <button
            class="map__button"
            disabled={this.zoom >= MAX_ZOOM}
            onClick={this.zoomIn}
          >+</button>
          <button
            class="map__button"
            disabled={this.zoom <= MIN_ZOOM}
            onClick={this.zoomOut}
          >-</button>
        </div>
        //...
      </div>
    );
  },
};
</script>

<style lang="scss" scoped>
.map {
  // ...
  &__controls {
    position: absolute;
    left: 16px;
    top: 16px;
    display: flex;
    flex-direction: column;
    justify-content: space-between;
    height: 56px;
  }
  &__button {
    border: 0;
    padding: 0;
    width: 24px;
    height: 24px;
    line-height: 24px;
    border-radius: 50%;
    font-size: 18px;
    background-color: #ffffff;
    color: #343434;
    box-shadow: 0 1px 4px rgba(0, 0, 0, .4);

    &:hover,
    &:focus {
      background-color: #eeeeee;
    }

    &:disabled {
      background-color: rgba(#eeeeee, .4);
    }
  }
  // ...
}
</style>
就是这样。我们仅用两个步骤就用 Vue、D3 和 OpenStreetMap 创建了简单的交互式地图。
结论
借助 D3 的强大功能和 Vue 的响应式特性,创建自己的地图视图组件并不难。我认为最重要的一点是完全控制 DOM,而不是使用一些抽象的地图渲染器 API,因为这些 API 会用我可爱的元素做一些晦涩难懂的事情。
当然,为了制作出功能强大的地图,我们需要实现更多功能,例如平滑缩放、最大边界等。但所有内容都是完全可定制的,因此您可以做任何您想做或需要做的事情。
如果您发现这篇文章有用,我可以写更多有关如何改进此地图并在其上显示数据的内容。
请随时提出您的问题。
鏂囩珷鏉ユ簮锛�https://dev.to/denisinvader/creating-an-interactive-map-with-d3-and-vue-4158